My Carbon Footprint in Svalbard
Hi again! I left Svalbard about two weeks ago, so I am now writing this fourth and final blog post from a hotel in Wyoming, as I make a pilgrimage across the country in a caravan of other geology students from around the US. I’ve been launched back into the readjustment processes of non-Arctic life; however, while driving through Yellowstone National park today we saw about an inch of snow accumulation and balmy temperature at freezing— so maybe home isn’t quite so different than the Arctic after all. Regardless, since I’m no longer making my way through the streets of Longyearbyen as a semi-local, I’m now able to begin truly synthesizing and processing the events of this bizarre, incredible, life-changing experience. In addition to thinking about the huge array of things that I personally got out of the semester though, it’s equally important that I consider my personal impact on the environment around me. Therefore, this final blog post will focus my carbon footprint while on Svalbard, while also discussing the reality of attempting to quantify such a number.
When I first started thinking about this blog, I knew that calculating my carbon footprint while on Svalbard would be no simple task due to the uniqueness of such a place. As I mentioned in an earlier post, the town of Longyearbyen obtains all of its electricity and heat from a coal power plant, which is the only coal plant still in operation in all of Norway. This fact contributes to the staggering statistic that if Svalbard were a country, it would have 150% the per capita CO2 production of the actual country (Qatar) that tops the charts, with Svalbard having a CO2 footprint of 60 tons per person per year. Of that amount, 40 tons are produced by the emissions of the coal plant, and the other 20 tons are largely encompassed under the category of transportation in terms of both people and goods.
Keeping these numbers in mind, I also wanted to see how the values compared to my carbon footprint according to carbonfootprint.com/calculator. This online calculator mainly asks for info regarding how frequently you travel by plane, car, etc., how big your house is in relation to how many people you live with, and what type of food you eat. In entering such information from my semester, and converting it to cover a full year, I got a carbon footprint of 3.16 tons of CO2. At approximately 5% of the 60 tons published value for what my carbon footprint was actually closer to, and 50% of the average Norwegian carbon footprint, there was obviously something pretty far off base with this number.
The best hypothesis that I have come up with to explain the number disparity is that the carbon footprint calculator is mostly focused on “primary and secondary consumption,” meaning the more direct things that a person does to increase their carbon footprint, instead of a term that I’m calling “tertiary consumption,” which includes an additional degree removal of the non-direct-yet-still-very-real things that a person does to increase their carbon footprint. For example, I didn’t eat any meat this past semester, mostly due to high cost and low quality, and so my carbon footprint, according to the calculator, could have been about 1 ton of CO2 higher if I had been a carnivore. However, the calculator didn’t question how far my food had to travel, which would be more than 2,000km if it was all coming from the Oslo—likely contributing to a much higher carbon footprint than eating locally sourced meat. Another example is that the calculator asked how big my house was, how many people lived in the house, and how the house was heated, which are all what I would consider more immediate consumption statistics. Yet it didn’t ask about the temperature of the surrounding environment. Presumably, heating a building in the Arctic requires much more energy (and when using coal, CO2 production) than heating a building in a more moderate environment, but understandably, it’s impossible to take into account all of these additional factors.
In many ways, trying to calculate my carbon footprint for a semester in Svalbard posed a very difficult challenge due to its geographic location and total isolation. In that sense, the most accurate calculation probably comes when I simply take responsibility for a fraction of Svalbard’s total footprint, which would then take into account the baseline emissions needed to keep the settlement up and running. However, in the end, attempting to quantify this number from Svalbard has been a very valuable task, because it makes so obvious the myriad of ways that my carbon footprint expands by factors beyond those that are commonly discussed or seen.
Though there are some alternative energy sources that are entering the conversation in terms of Svalbard’s sustainability, specifically by way of wind power, there has yet to be any solutions that don’t result in a variety of negative externalities. Regardless, who knows what the future holds. I feel incredibly grateful that I got to spend the semester where I did, but working on this blog has helped me realize the innate problems of Svalbard that I passively contributed to while studying there. Like any complex problem in life, there isn’t one way process it, but being conscious of both the good and the bad is at least a start.

One of the few sunny days in late May. Cold temperatures meant that the snow stuck around for a while, and the skiing was plentiful!
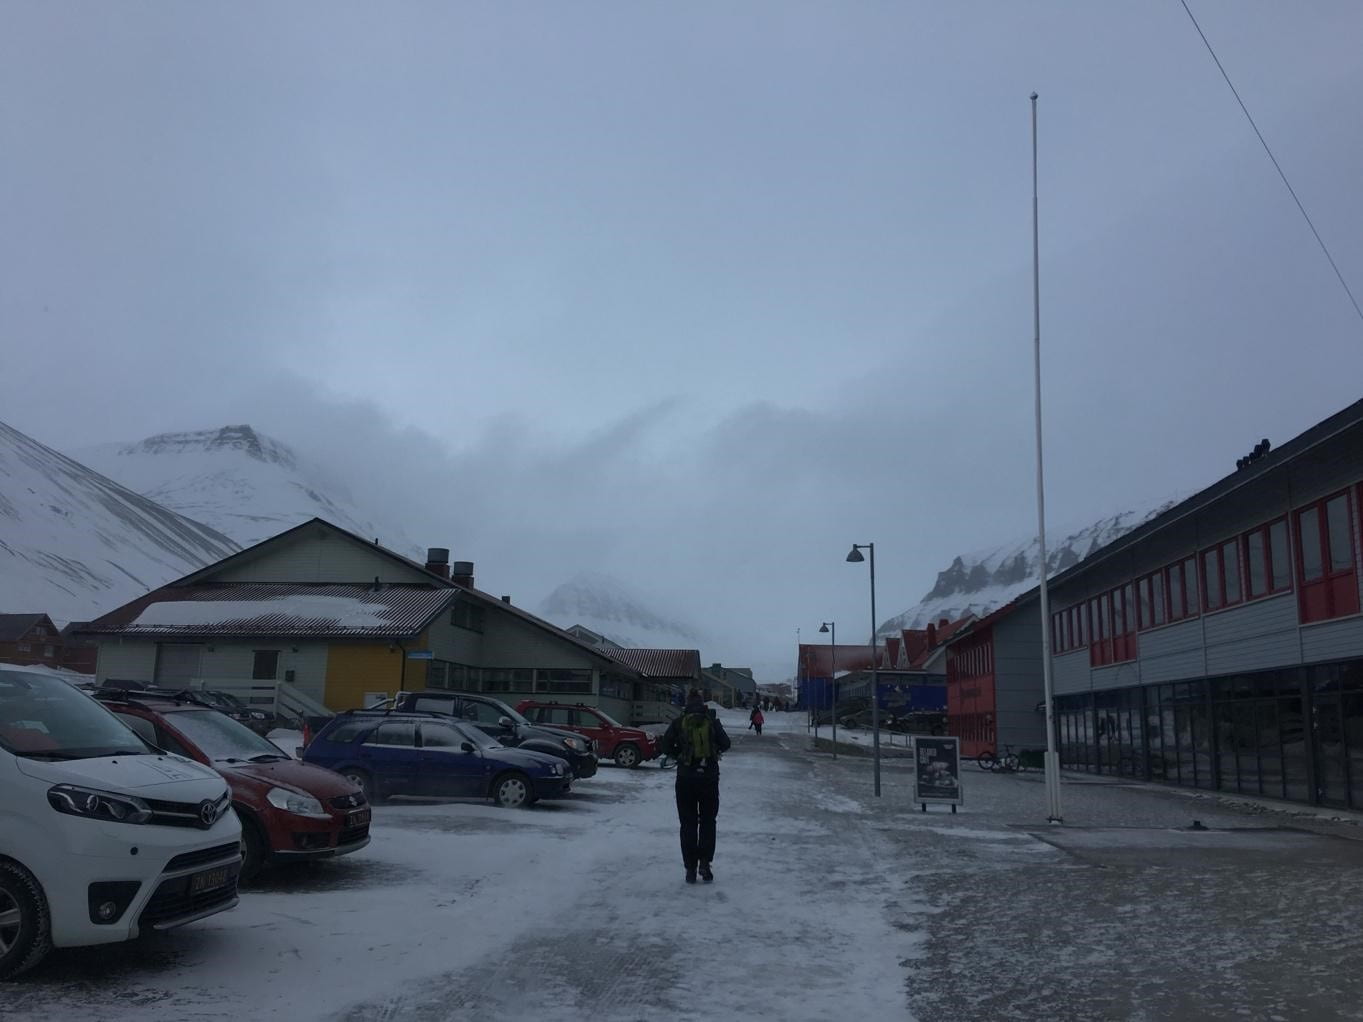
Walking down the main street on a blustery and cold day in May. It’s wild to think about how much energy is needed to keep this place warm all year.
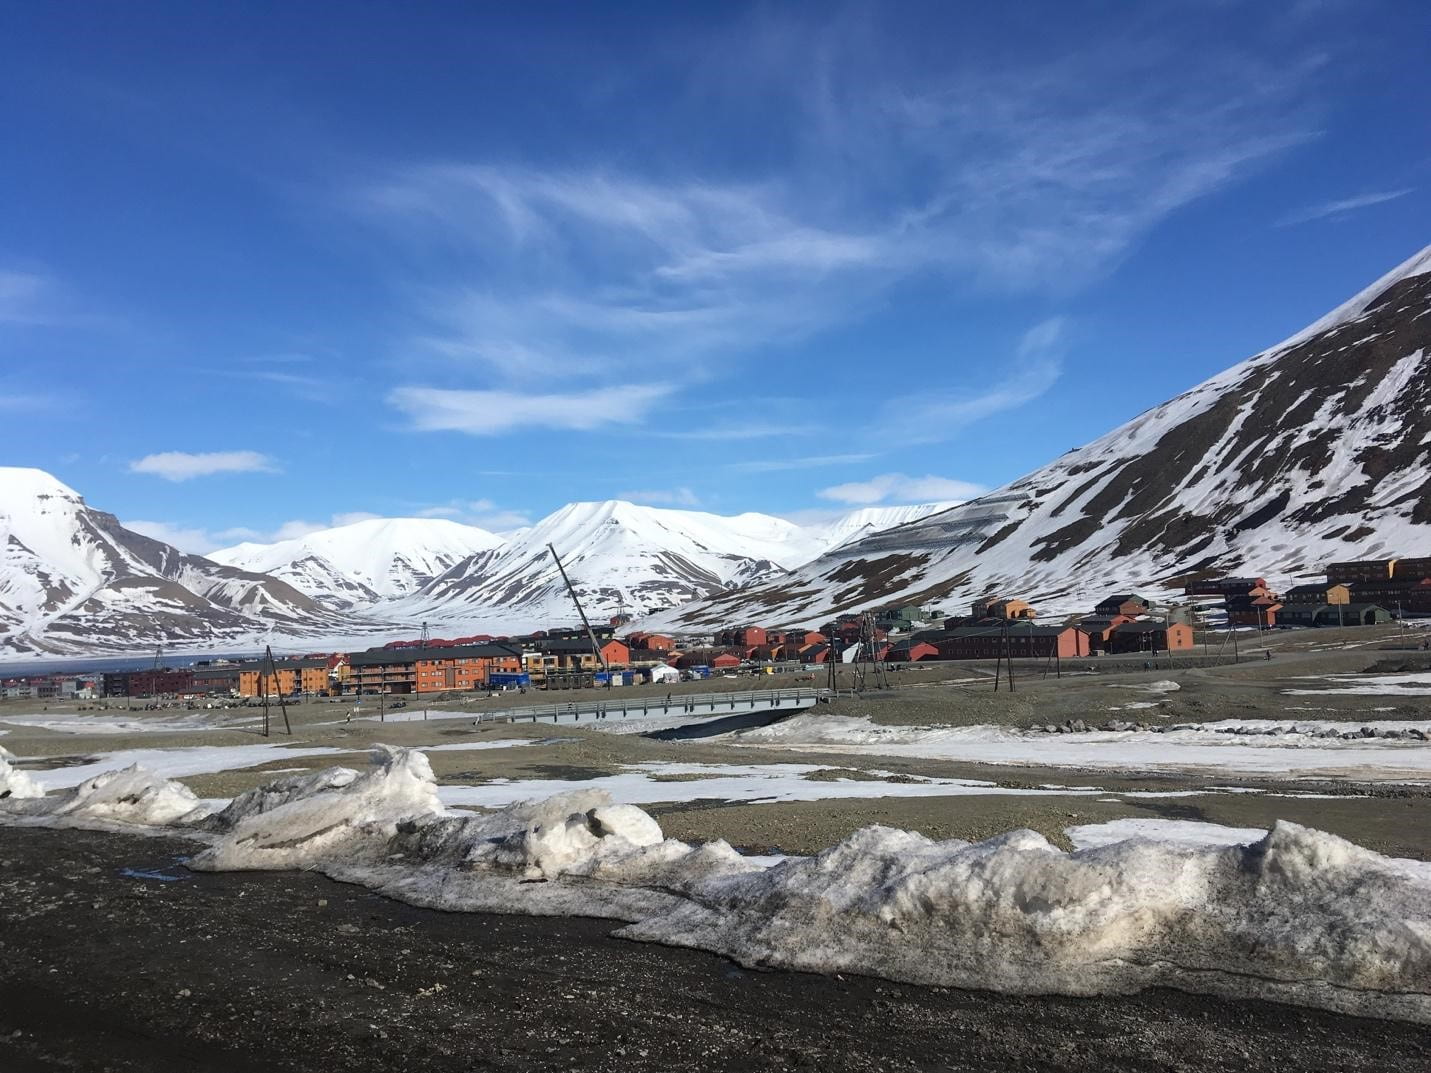
One of my last days in Svalbard. The snow was starting to melt real fast, especially when we had a string of rare blue days like this one!